What do you do after you send an email campaign out? Do you move on to the next to do item, or do you just keep the campaign reporting page open, clicking refresh every 2-3 minutes while the results come in?
I’m guilty of the latter, and I doubt I’m the only one. Email marketing spoils us with stats. We can track so many different things, and in such detail, that it can turn you into a data junkie.
Of all the email metrics analytics available, open rates seem to attract the most attention. They’re the first thing a colleague asks if they want to know how a campaign did. Open rates are probably also the first stat you – and I – watch as we hit refresh on those reports again and again.
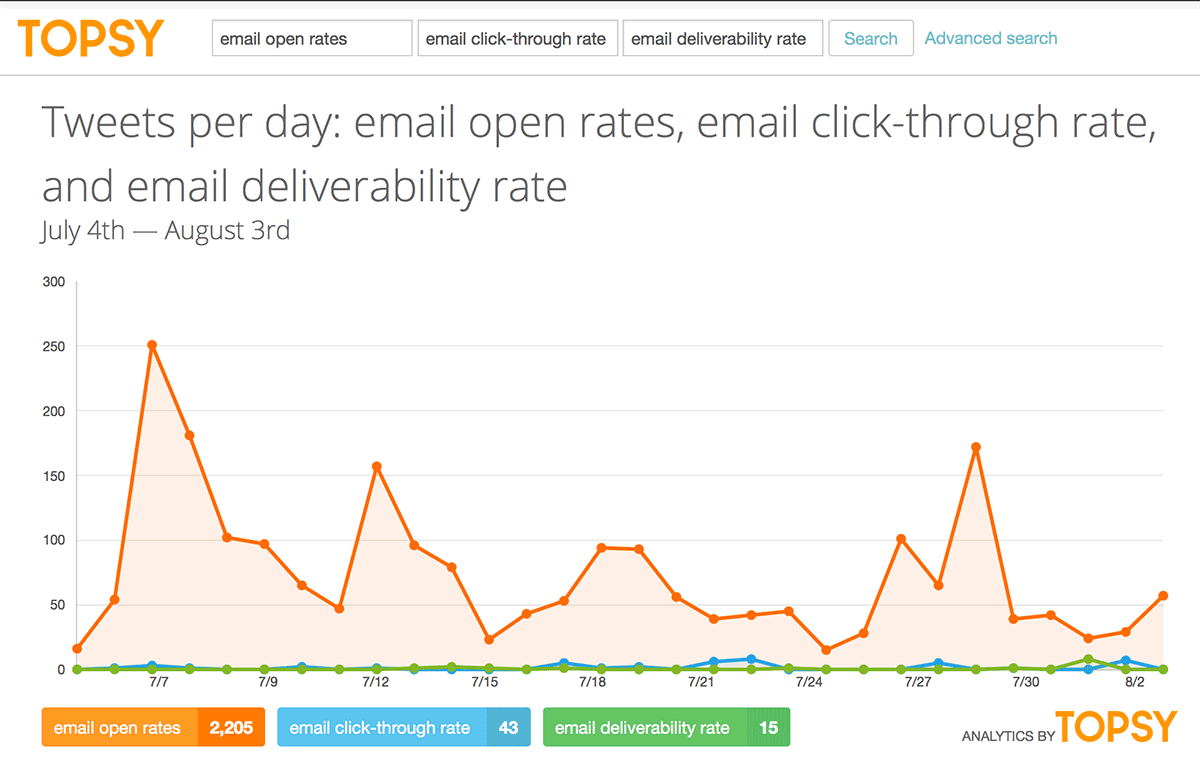
But I wanted a bit more objective data than that. So I ran a bunch of terms for email metrics through Topsy. Then there was no doubting it. “Email open rates” got more than 20 times the tweets than almost any other metric, including “email deliverability rates."
Understand that this isn’t just another quick tips list on how to kick up open rates. We’re going to take things a step deeper and look at testing, too.
Why bother with testing? Because all the open rate best practices are great, but they don't necessarily reflect how your list behaves. So we’re going to take one of the suggestions for improving open rates and do an A/B split test to see if it works for us.
What do you think influences open rates?
Could it be your…
- Deliverability rate
Surely the deliverability rates have to be decent, or your subscribers would never see the email in the first place.
- Mailing frequency
How often you send can affect changes to your unsubscribe rates, but could it quash opens, too? It seems so.
This study from the Database Marketing Institute found that the more frequently B2B emails were sent, the further open rates dropped.

Marketing Sherpa published a case study on open rates recently that found a similar trend.
Ah, now here’s the big kahuna. Subject lines are generally considered to have the most influence over emails. And it’s a pretty good assumption.
Fortunately for us, the annual Adestra Email Subject Line study just came out. And they broke out B2B emails for this year’s analysis. Here’s what the data shows:
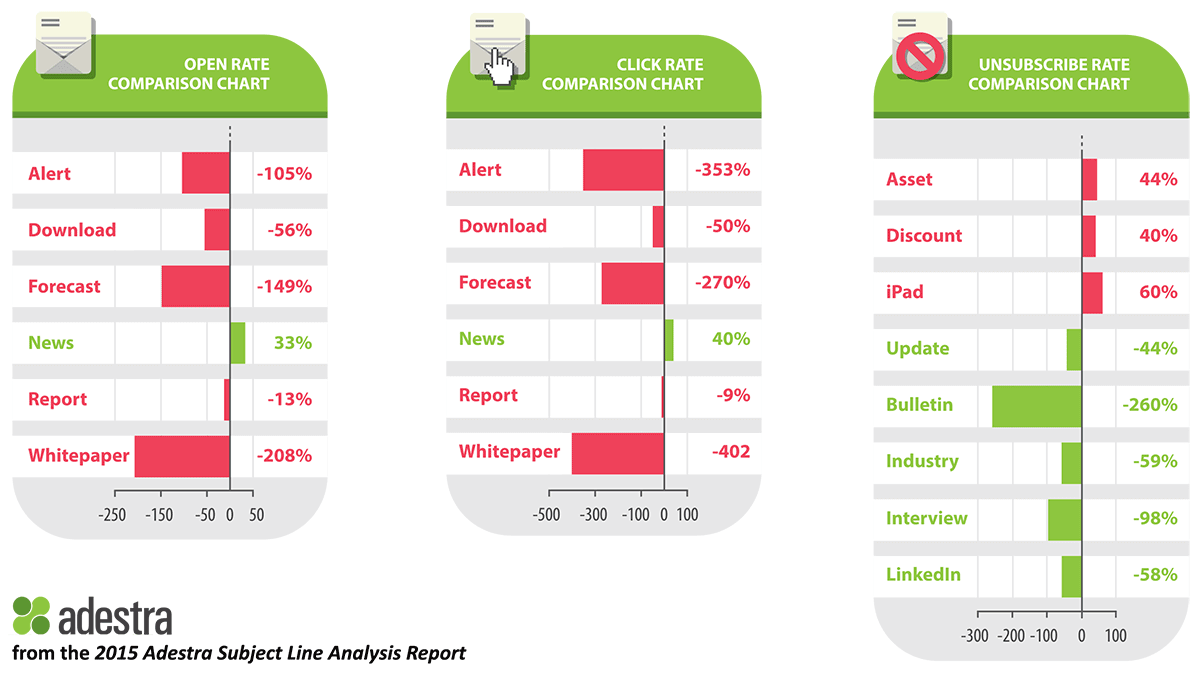
The complete report shows this data for 50 more words, but the graphics above show the words with the most dramatic shifts. Other words that suppressed engagement were “white paper”, “revenue” and “ROI”.
- Sender name
As you probably know, an email’s sender name is prominently shown next to the subject line. On mobile devices, it’s actually larger than the subject line. But while this is something people see a lot, there’s not a lot of play here. You don’t want to be changing your email sender name very often.
That’s why it might be a little risky to have the company’s sender name be from an employee. If that employee leaves, or gets fired, you’ll be in an uncomfortable spot. But I could be wrong. Forbes contributor Sujan Patel recommends sending from an employee’s name, because
“An email from a company gets marked as advertising immediately, which can get your email deleted. An email that appears to be coming from an actual individual at your firm is more personal and much more likely to get opened.”
- Preheader text
A well-written preheader can influence open rates. However, Marketing Experiments did two A/B split tests with preheader texts earlier this year. While the preheader text did affect clicks in both tests, neither test saw any significant increase or decrease in opens.
That’s interesting…perhaps the preheader text gave enough information that people decided to skip the email. But those that were interested were more likely to click?
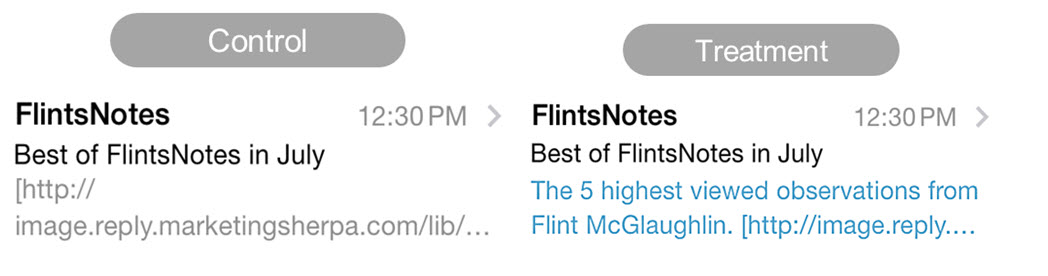
The treatment version of this A/B split-test of different preheader text got a 104% increase in clicks. But oddly enough, there was no statistically significant difference in the open rates of the two emails.
- Time: Time of Day and Day of Week
These are both common things to test, and they can influence open rates by a lot.
- Email content
I almost didn’t add this one. At first it didn’t make any sense to me how email content – the stuff people see after they’ve clicked – could affect email open rates. But it does. Hammock, a B2B marketing content company, proved how email content affects open rates.
Hammock had been sending emails that had a lot of content: five to seven articles, with more than 1,000 words per email. They wanted to trim that down to a mere 350 words, with no more than three ideas per idea.
This is what the emails they have been sending looked like:
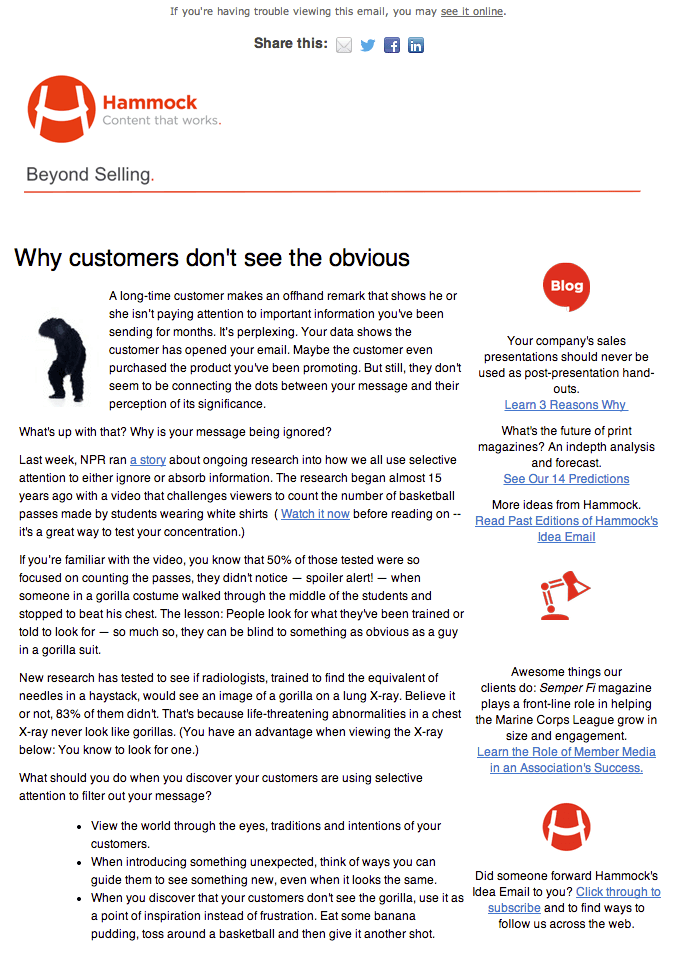
This is what their new emails looked like:
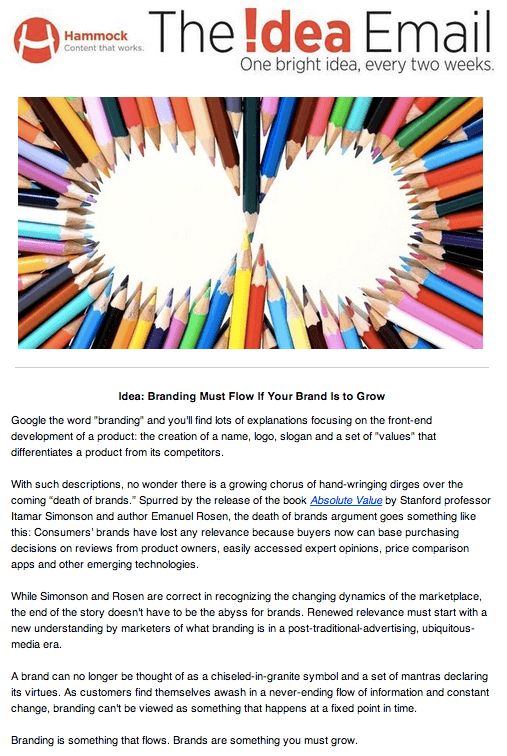
The simplified version increased open rates by 48%. However, their click-through rates have dropped a little. Not much, but a little. Still, Hammock is satisfied with the change.
- Segmentation and Personalization
I’m sure you’re aware of how much these can affect open rates. I’m lumping them together because they are pretty much the same thing. Segmentation breaks your subscribers up into groups. Email marketing personalization does that, too – it’s just that the “groups” are groups of one.
In the context of open rates, the best example is probably personalizing the subject line. Usually, that means inserting someone’s first name into the subject line, like this:
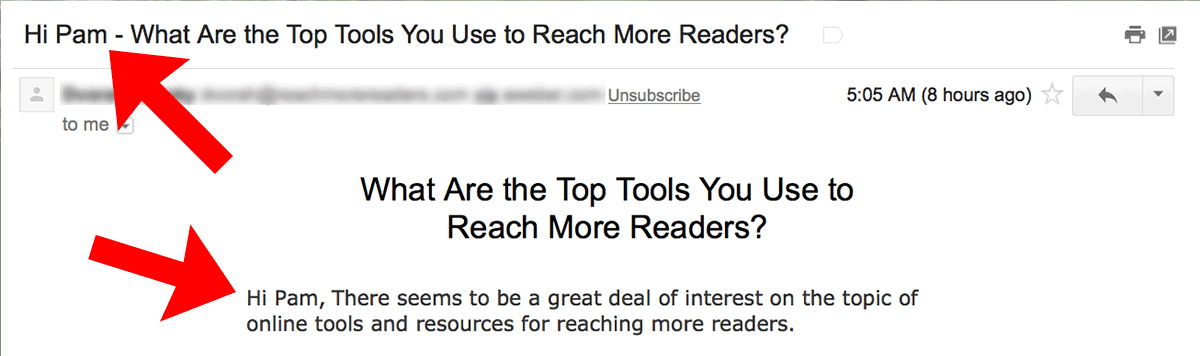
This email sender personalized the subject line and also added my name to the first line of the email.
- Perceived value, or how much subscribers trust you
I think this one might trump even the subject line when it comes to determining open rate. It’s also one of the few things we can’t quantify, or at least haven’t been able to quantify yet.
Bear with me for a moment. I want to cite an imaginary test to explain this.
Let’s assume you’ve got a great relationship with your subscribers. You send them truly must-read emails every week. They read every word of those emails. They save them to folders. They forward them. Your readers practically cherish your emails. They are successful email campaigns.
Here’s the test: You and some other, far less awesome email marketer decide to send the same email. It’s got the same subject line, sender name and preheader text. It’s the same content, it’s sent at the same time, etc, etc. Let’s even assume we can wave a magic wand and your deliverability rates will be the same for this one email.
I bet you’d still get an awesome open rate. And I bet your less-awesome colleague – the one with historically poor engagement metrics – would get a pretty rotten open rate.
Why would this happen? Because your subscribers trust and like you. They’re not so hot about your colleague.
Some marketers call this “training” your subscribers to open your emails. That is essentially what you’re doing, but the word “training” is a little off. Still, too bad we don’t have a nice quantitative measure of subscribers' trust.
Increasing Open Rates: How to find out what works for you to
That’s all well and good. But what you need is to find out what works for your list. No problem. Here’s a step-by-step A/B split test of two subject lines, complete with the statistical analysis of whether I’ve got a winner or not.
These next few screenshots will walk you through exactly how to set up an A/B split-test for a subject line. It’s a snap to do. It took me about 7 minutes to set up the entire test.
1) I’m logged into my Pinpointe account here. I’ve got the first email created.
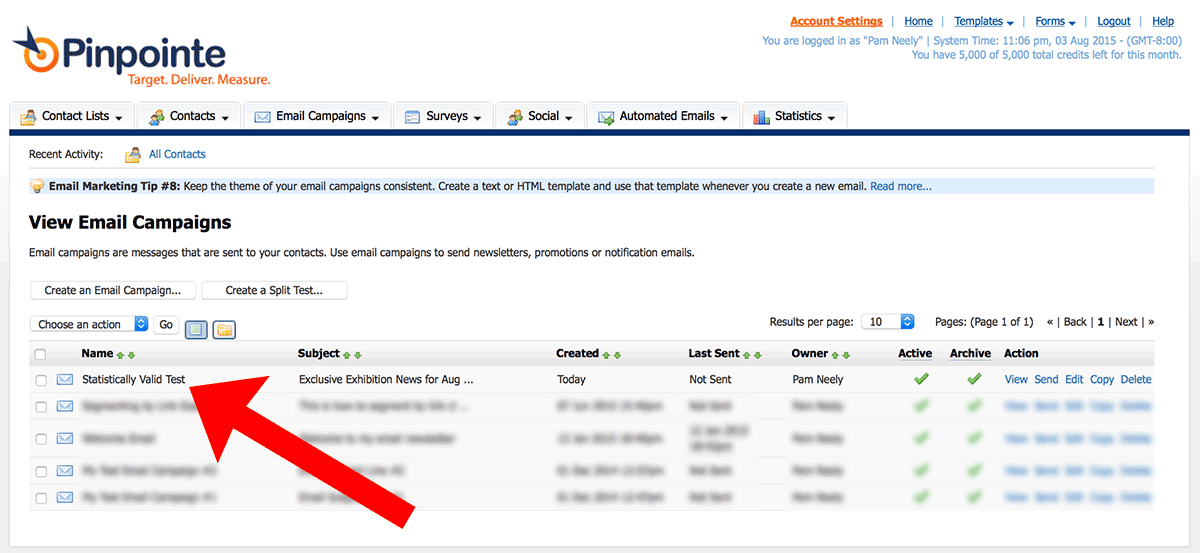
2) To create the second email, I just copy the first email, change one word in the subject line, and save the new email. I’ve labeled it “Statistically Valid Test Version 2” in the screenshot below.
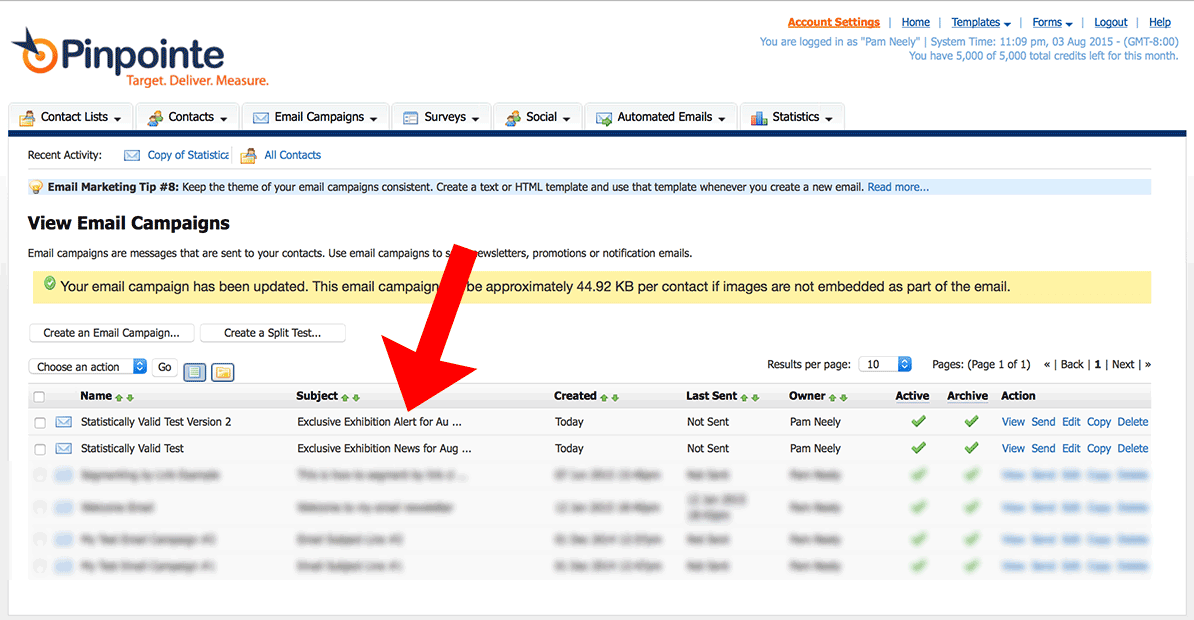
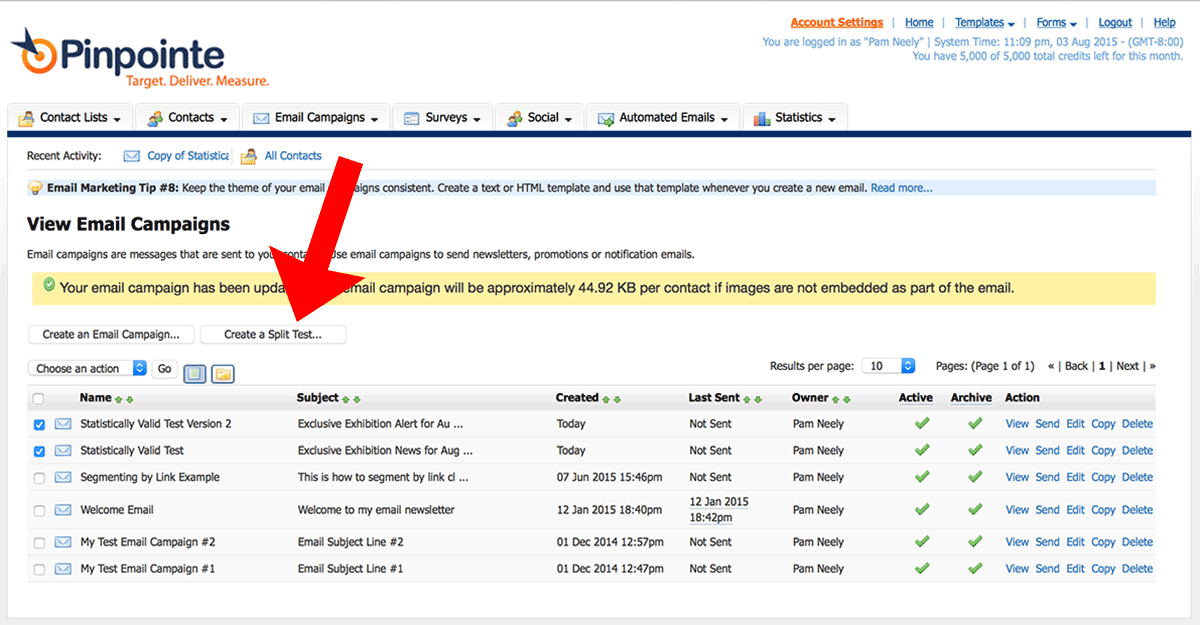
3) Then I just select the two emails and click the “Create a Split Test” button.
4) On the next page, I give the split-test a name. Then I select which emails (aka “email campaigns”) that I want to include in the test.
I’m big on naming tests clearly enough so I can immediately recognize them a year or two from now. This test name includes both the date, a three-word description of what I’m testing, and then the two things I’ve testing. One version of the subject line is “Exclusive Exhibition Alert for August 5th”. The other is “Exclusive Exhibition News for August 5th”.
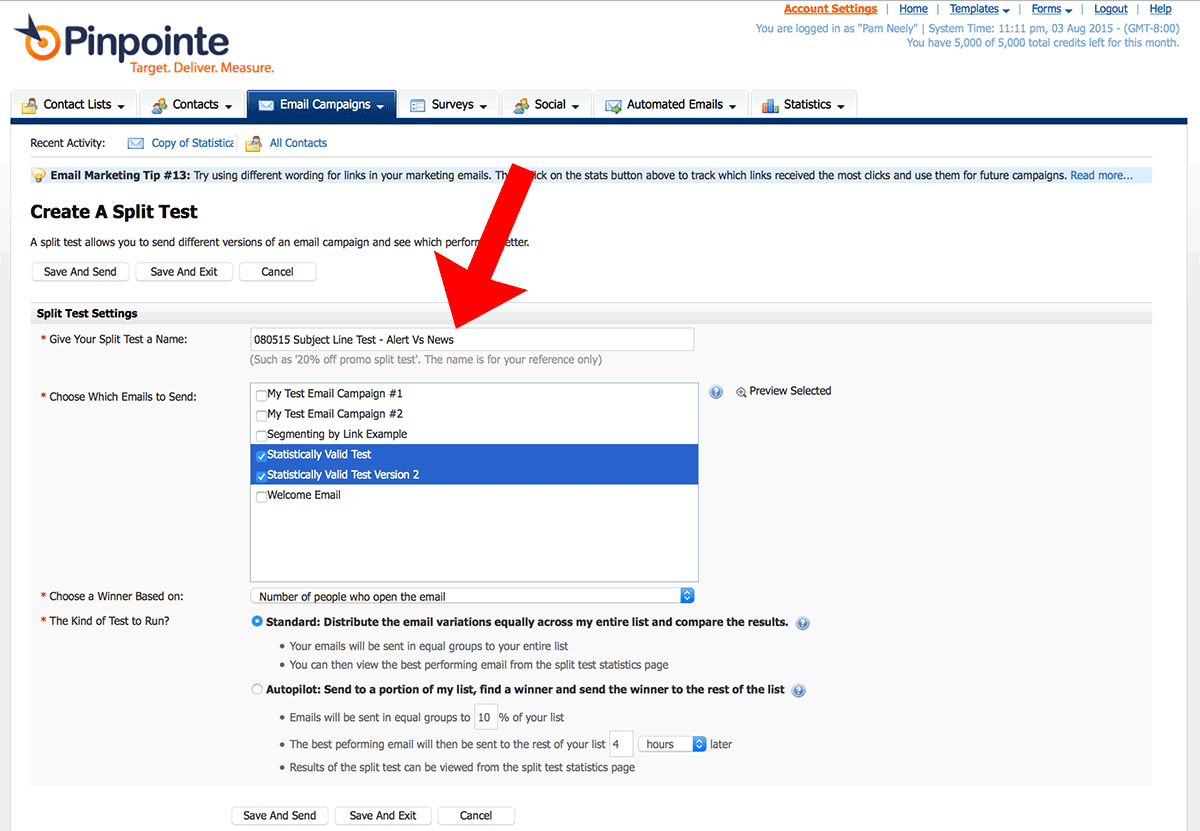
I used all the basic settings on this page. I just wanted to do a quick test.
Note that I’m not using the special “Autopilot” testing option. My test list isn’t big enough. I'd need at least 3,000 contacts to make this work. But if your list is big enough, use this feature to send each one of your test emails to a small segment of your list. Pinpointe will then automatically send the winning email to the rest of your subscribers. Large direct response companies have been using this testing-to-segments trick for decades. It’s one of the cooler benefits of having a large list.
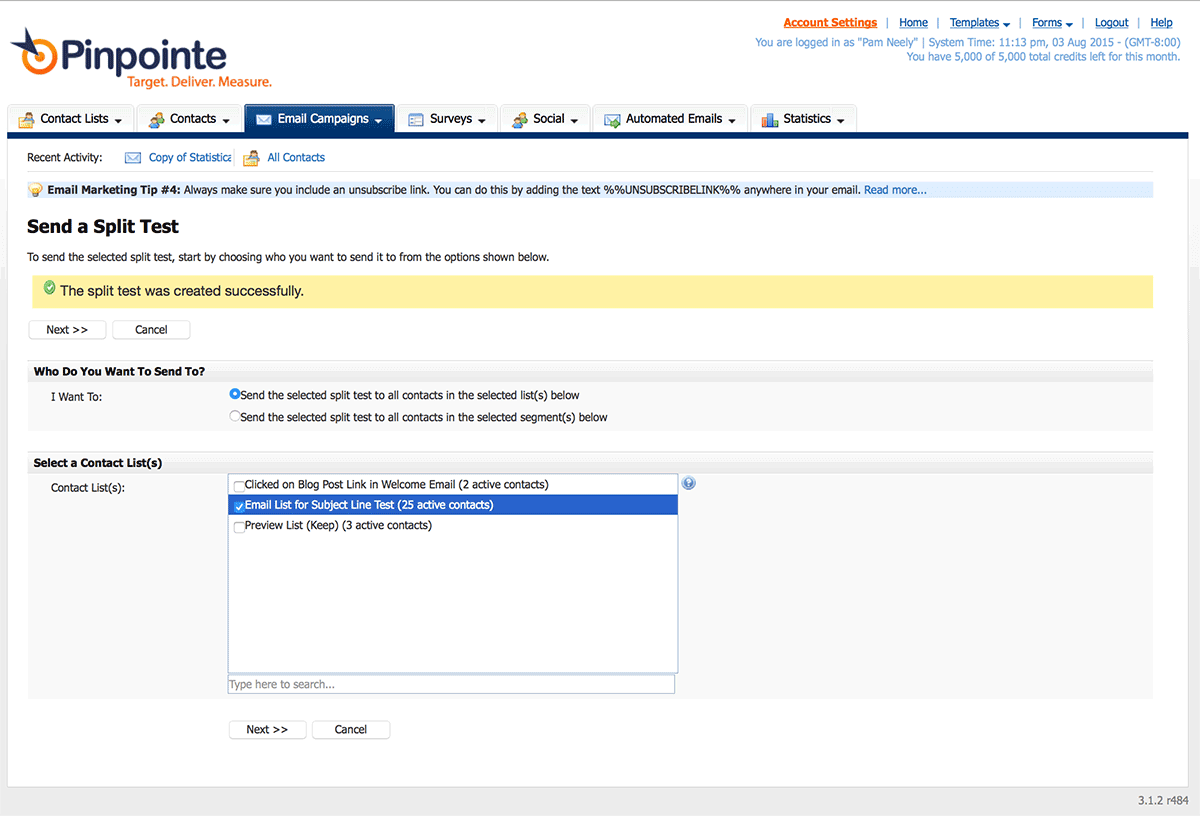
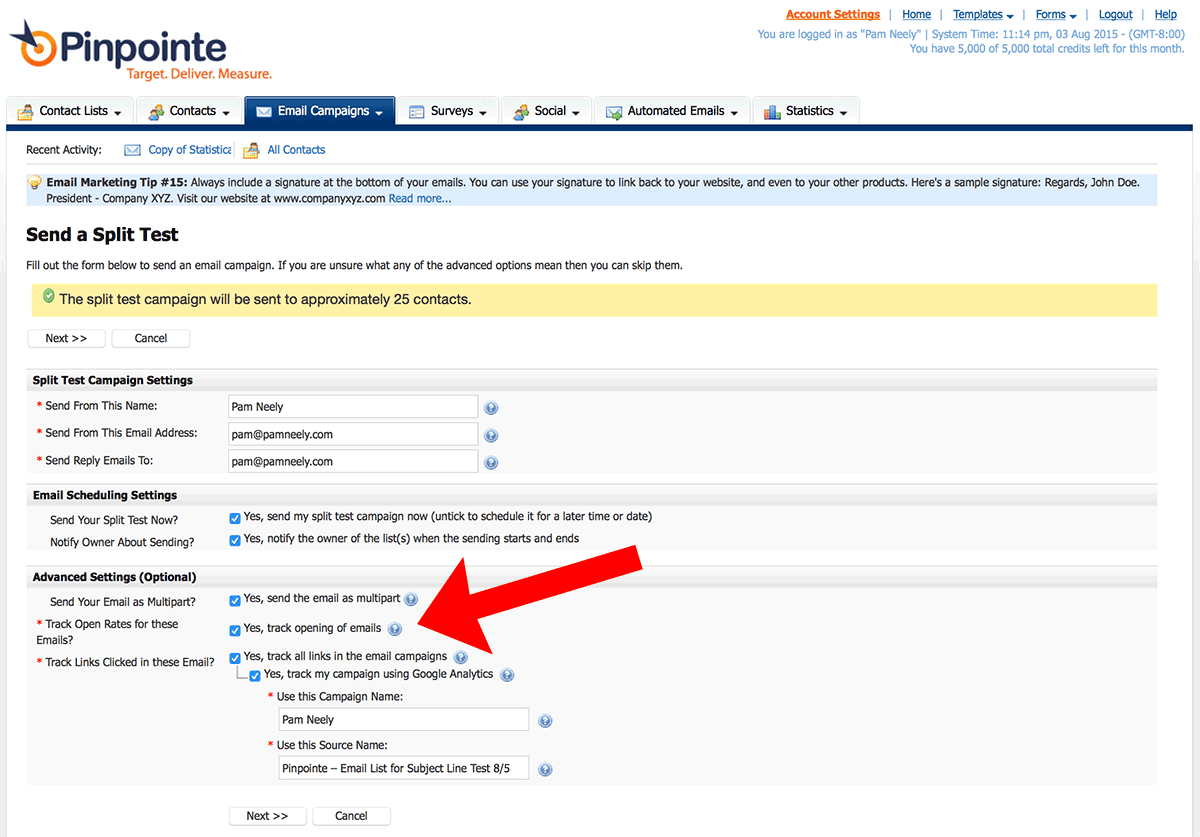
5) All I have to do on this screen is to select which list segment I want to send the test to.
6) Most of the default settings on this page were AOK. All I changed was to check the box next to “track opens” and then check the box to turn on Google Analytics tracking.
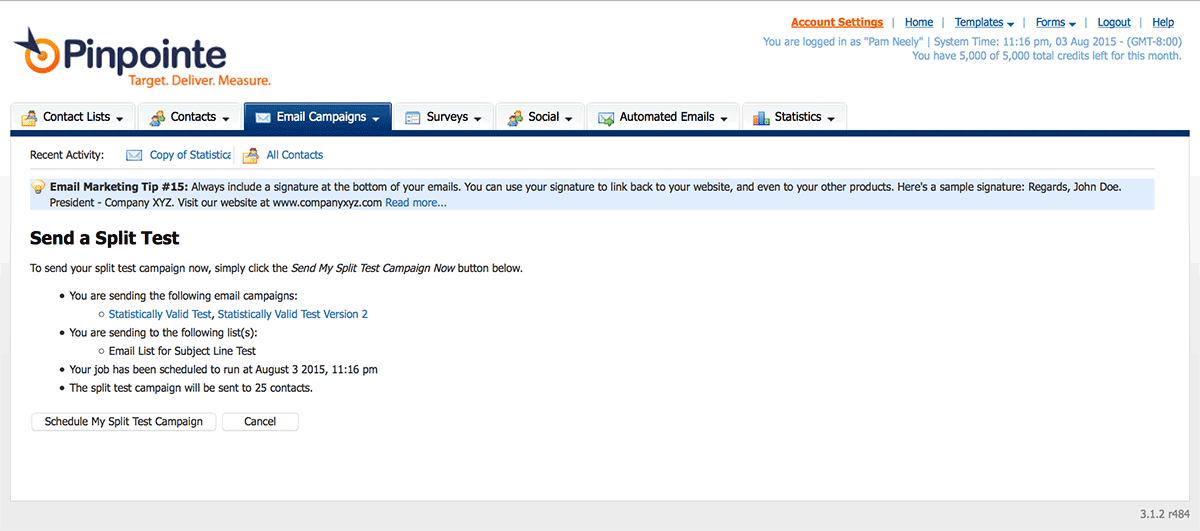
7) One last look for the final verification:
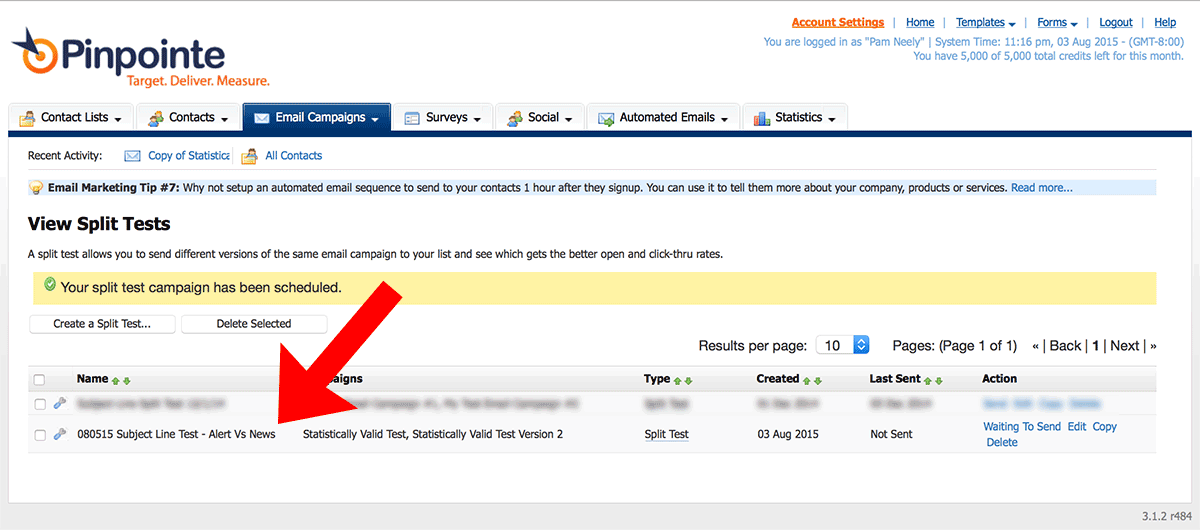
8) Here’s the screenshot showing the new split-test and it’s status. The emails went out within about 5 minutes of when I finished setting up the test.
9) When you’ve finished setting up your split-test, head over to the “Statistics” tab and look under “Split Test Statistics”.
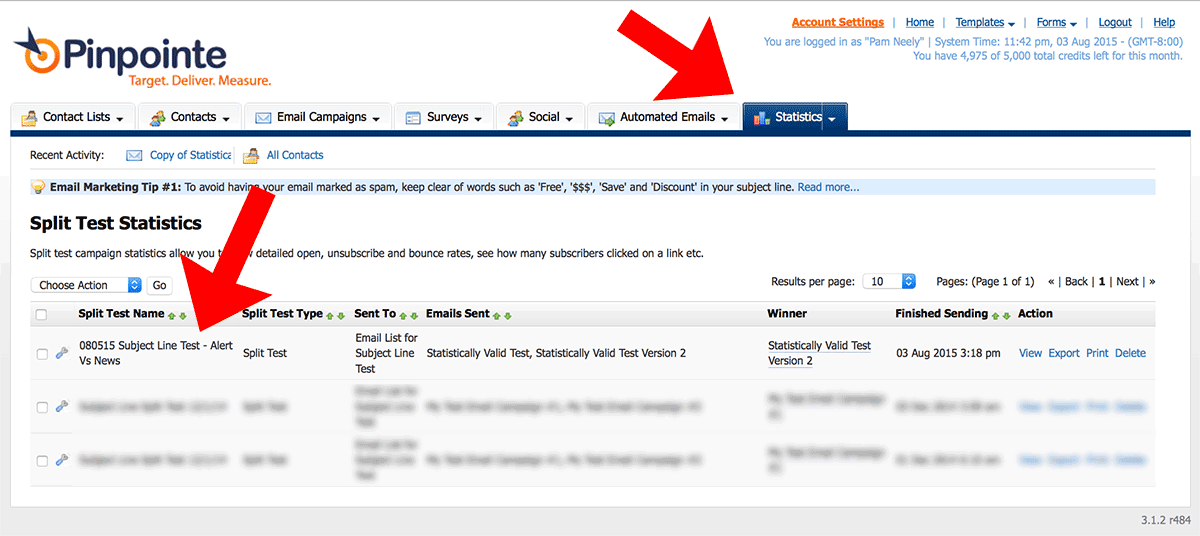
10) You’ll see a split-test report page. Here’s the one for my little subject line split test.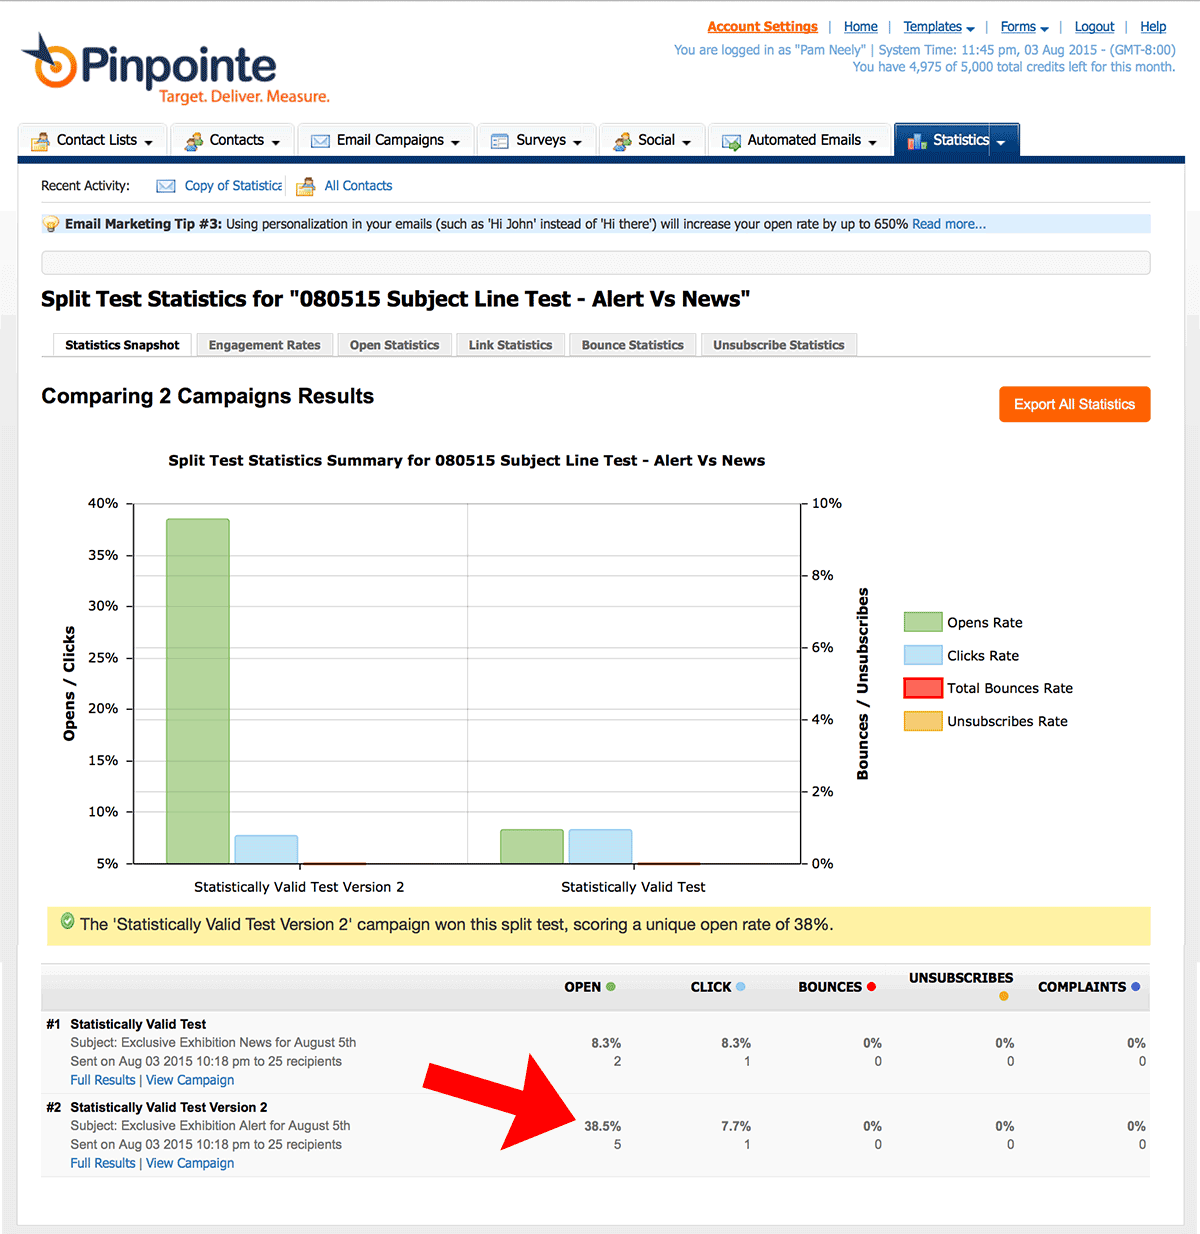
If you click on the link for “Full Results” in the bottom line of the test email description, you’ll see this:
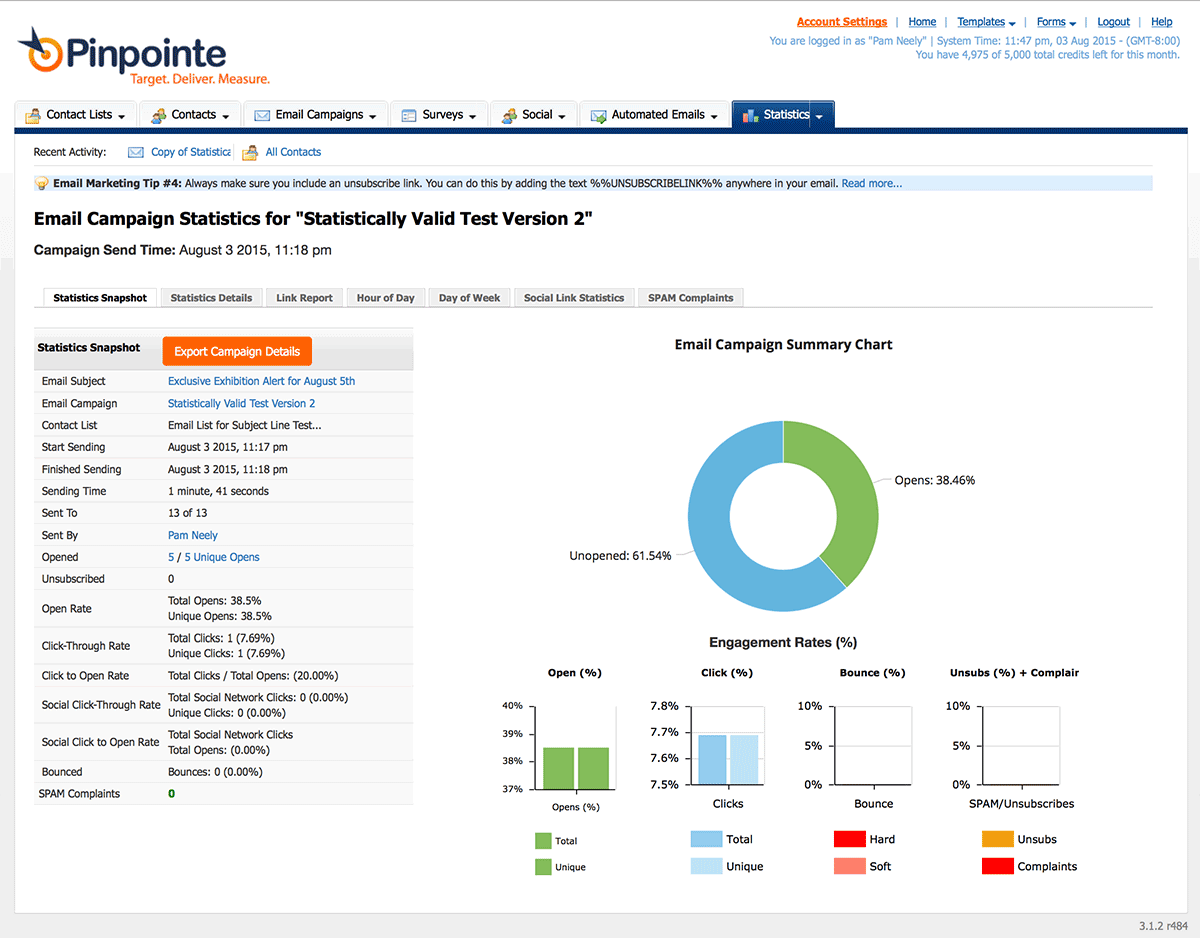
Pretty cool, huh?
There’s an important thing to note about this split-test, though. It’s not statistically valid.
How to tell if your test results are statistically valid
Why not? Because of the sample size. If you look closely at the detailed version of the split-test report, I only sent 13 emails to this test segment. So even though it looks like Version 2 crushed Version 1, this is not much better than playing rock/paper/scissors.
However, if I had 1,000 or more subscribers, and got a lift like this, I’d probably be able to call a winner. That’s because the difference in the open rates is so large.
But I still couldn’t be sure. In order to be a good, scientific marketer, I’d have to decide how much margin of error I was comfortable with. That’s because while this is math, we are working with probabilities here. Small sample sizes can result in huge margins of error. Margins so big, in fact, that the test results end up not meaning much.
Most marketers pick a 95% or 99% confidence level. The more confident you have to be, the larger a sample size you’ll require. You could, of course, drop your confidence level all the way down to 80% to keep your sample sizes small. But then you’d run the risk of one out of every five test results you called being wrong. You’d be wrong 20% of the time. That’s not so good.
So here are the three things you have to figure in when you analyze a split test. You have to
- Have a large enough sample size (sometimes called a “population”)
- AND a large enough difference between the two results. The larger the difference between the two results, the smaller a sample size you need.
- You have to decide how confident you want to be with your results.
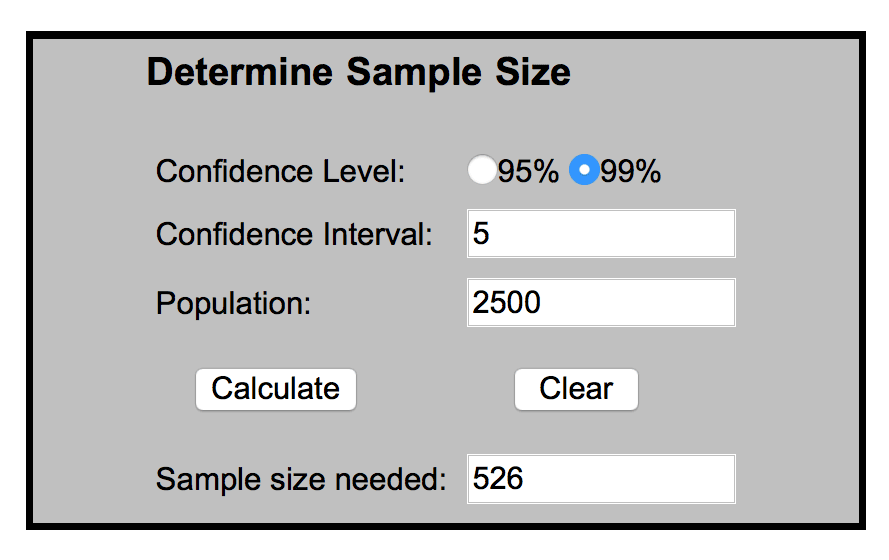
If you’re starting to get flashbacks to past traumas in statistics class, have no fear. Once we’re out of school, we get to use calculators. Like this split test calculator:
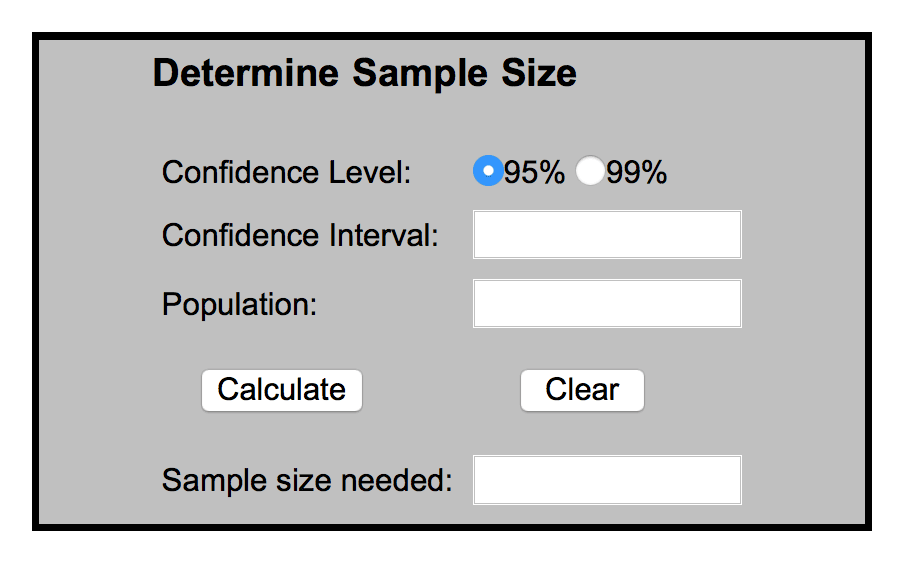
You’ll probably recognize all those fields, except “Confidence Interval”. That’s basically our margin of error, but more specifically how many percentage points up or down the actual results could be.
I’m going to enter in my test results, but with a much larger sample size.
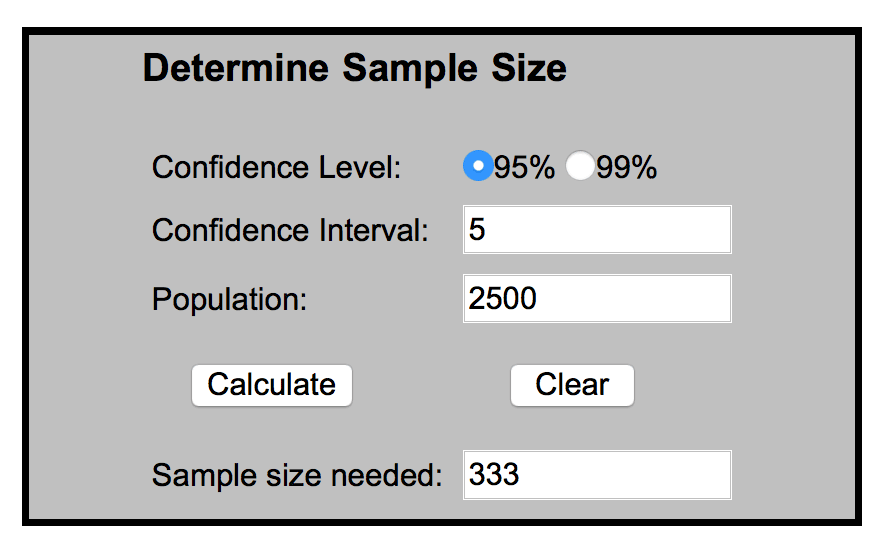
That’s not so bad. It means each one of my test versions needs to go to 333 subscribers (plus some margin for the vagaries of deliverability rate).
If I change the confidence level to 99%, the sample size goes up. A lot.
And if I drop the confidence interval down to 2, it goes up even more:
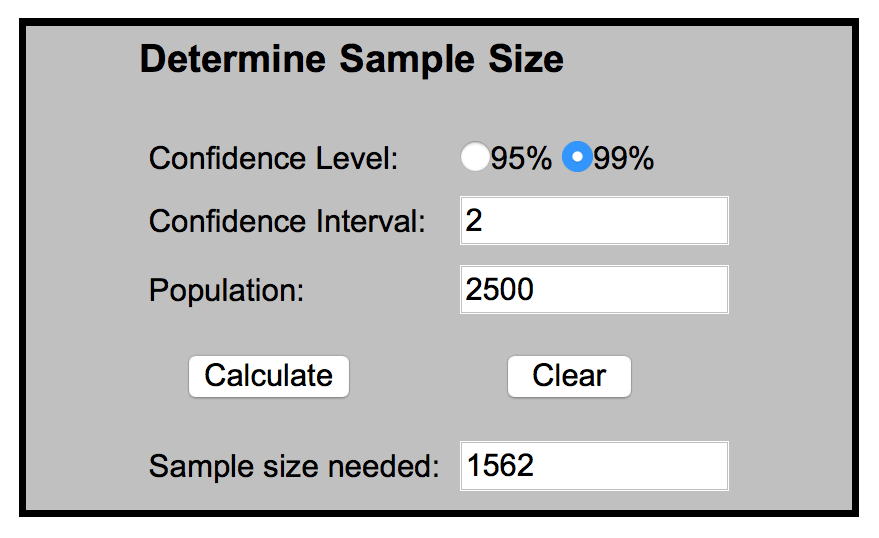
This is why some tests get “inconclusive results”. As you start testing, be prepared for that – it happens more often than we’d like.
Conclusion
That’s a not-so-beginner review of open rates and what influences them. It also gives you the tools you need to be a good split test scientist. Now when you read the latest report or case study about how some company tripled their open rates, you can go back to your “lab” (your email service provider account and your own list) and see if you can replicate the experiment.
To be honest, most of the time you’re probably not going to get the blow-your-doors-off results that the other company got. But even single digit lifts, over time, can add to big results by year’s end.