Email is one of the most measurable marketing techniques ever created. We can know just about anything about how a subscriber reacts with our messages through email analytics. But despite all that information, email marketing analytics can also be confusing. Sometimes, they are even unreliable.
To clear up some of that confusion, we wanted to give you a basic refresher course in email analytics. Most of you are far beyond email marketing 101, but it is surprising how many marketers can be just a wee bit hazy on the specifics of how email analytics work. That just may include you sometimes too. It’s also surprising how something as dry as email analytics can be so fraught with contention. Email marketers fight over some of these stats and their value.
Open rate
Let’s start with the most contentious email analytics measurement – email open rates. Open rates are one of the hardest metrics to track, but they are also one of the most used metrics in email marketing. Just about every email marketer measures open rates.
And yet, a lot of people say they’re useless. One major email marketing firm has called open rates “unreliable.” That’s because opens are measured by whether or not the images within an email message are downloaded. Typically one of those images is a tracking pixel, which is how Pinpointe tracks opens. This is the same reason we don’t track open rates for text only emails – there is no downloadable image to track in HTML-only emails.
To call open rates unreliable is being comparatively nice. The Smart Insights blog wrote a post titled “Email Open Rate, As Useful As Your Appendix.” Dela Quist, an especially outspoken email marketer, has said, “Open rates are good for one thing and one thing only. Misleading the people who use them as a metric.”
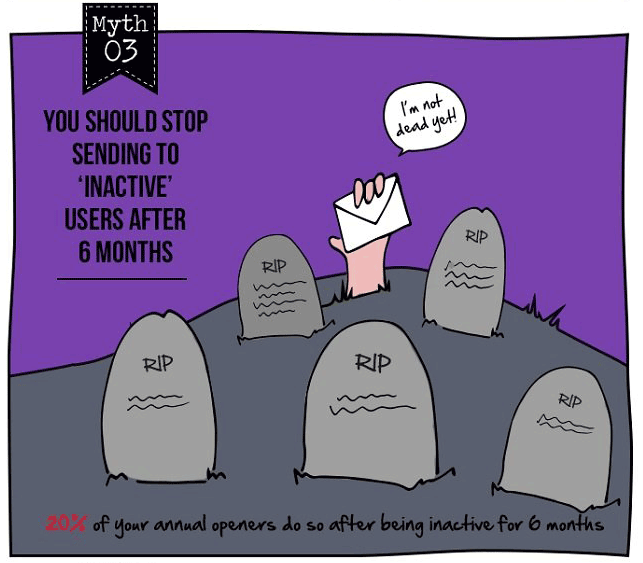
One place where open rates do matter is list hygiene. Many marketers choose which subscribers to remove from their list based on open rates. For example, if someone has not opened an email in 6 months or more, they are removed from the list. Once again, there’s contention about that technique. Some email authorities, like Dela Quist, point out “20% of your annual openers do so after being inactive for 6 months.”
Open rates aren’t disparaged just because they’re hard to track. They also don’t necessarily translate into conversions. An email message with a mediocre open rate could have the best ROI of the year, and an email message with outstanding open rate could end up just attracting a lot of looky-loos.
The email analytics marketers should care about relate to their ROI – their conversion rates and revenue per email. Opens are nice, but what counts is sales. As those of you with testing backgrounds know that you don’t optimize for open rates. You optimize for conversions.
Click-Through Rate (CTR)
After all the hullabaloo over open rates, you’ll be happy to know click-through rates are a reliable metric. Click-through rates aren’t skewed by technology kinks. Email marketers universally agree they are a meaningful measurement.
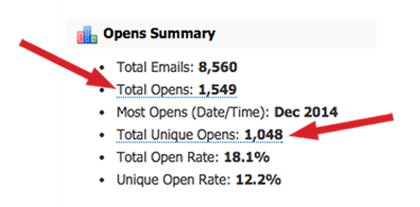
One place where measuring click-through rates can get more complex is unique clicks versus overall clicks. When you look at your click-through rate report, check how many of those clicks are unique. Some email subscribers may have clicked three, four, even ten times on your email. That’s not a bad thing, but it gives some depth to the data. Your Pinpointe tracking reports show both total opens and clicks, and unique opens and clicks.
Bounces
Bounces come in two flavors: Soft bounces and hard bounces. Soft bounces occur when a subscriber’s inbox is either temporarily full or inaccessible for a short period of time. Hard bounces happen when an email message is sent to an email account that no longer exists.
Purge your hard bounces as soon as possible, if your email service provider doesn’t automatically do that for you. After five soft bounces, the Pinpointe system will mark a subscriber as a hard bounce. Hard bounces are not removed from your list, but the system will no longer send emails to them. See our Knowledge base article for more about the specifics of how Pinpointe defines and manages bounces.

Unsubscribes
Unsubscribes are a fuzzy metric. They’re not fuzzy due to the technical aspects of how their tracked, but because of the way subscribers tend to behave.
People unsubscribe in three different ways. The first way is to use the unsubscribe mechanism in your emails (or go to your site and use an email preferences center). That’s the trackable way we count unsubscribes.
Other people won’t take the time to unsubscribe. They’ll just delete the email, and keep deleting your emails, for months on end. These people are sometimes described as “psychologically unsubscribed.”
Finally, a small fraction of people will mark your email as spam rather than hassle with going through what could be an onerous unsubscribe process.
Unsubscribes are good for one thing: Seeing when your list doesn’t like something. A spike in unsubscribes can show an obvious dislike for an email you’ve sent, and so that might be a clue to change your messaging next time.
Don’t necessarily let unsubscribes push your marketing around. For that same email that got a spike in unsubscribes – how were conversion rates? Ultimately, none of this is about list size or even about across the board engagement rates. It’s about revenue.
Forwards (also referred to as "Email Sharing")
This is how many times someone forwarded your email to another person. It is different from social shares, which is when someone likes or shares your email. You can set up forward to a friend functionality in your Pinpointe account in a matter of minutes. See our knowledgebase article for instructions.
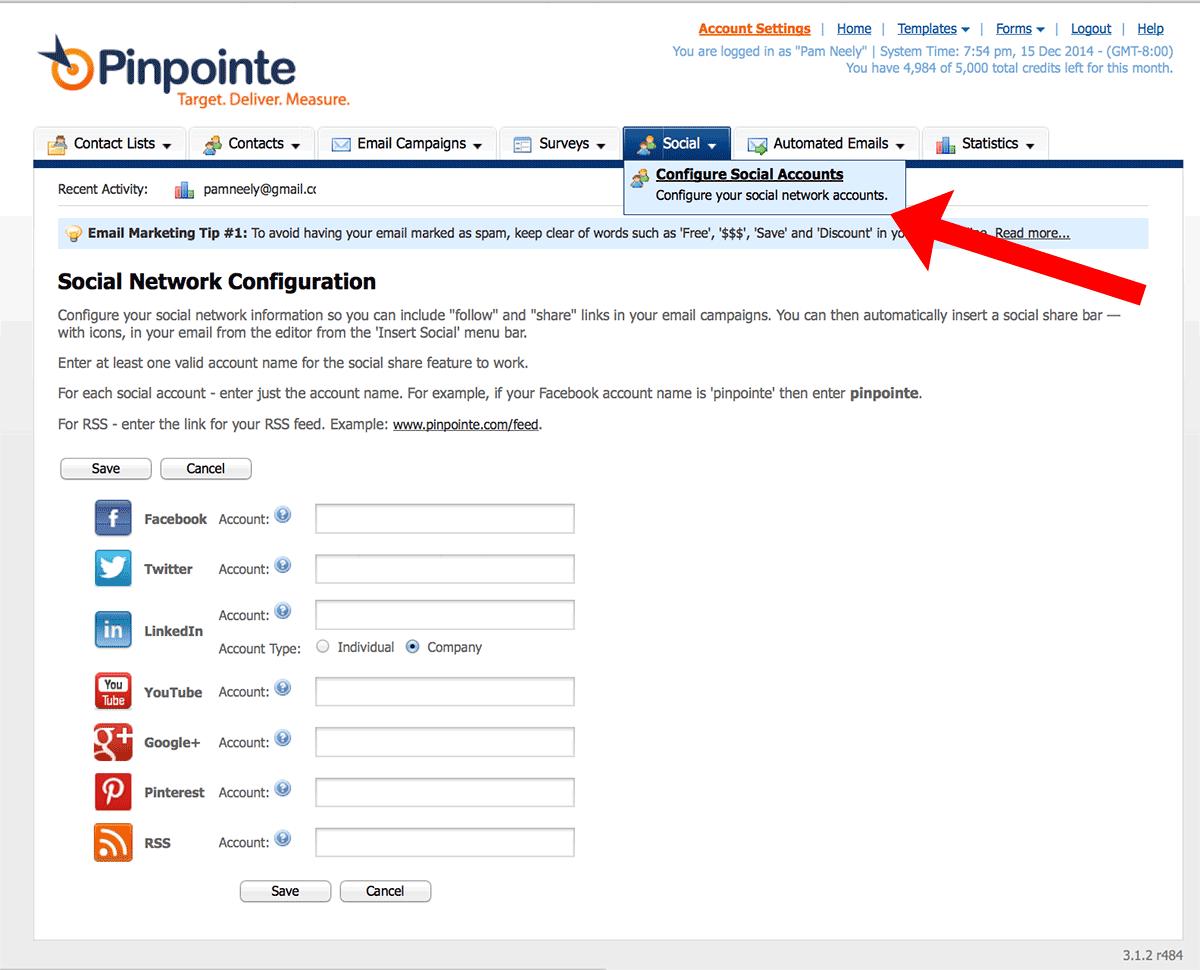
If you are interested in setting up social shares, you can do that in Pinpointe too. Set up social sharing icons by going to the "Social" tab in your account. Click "Configure Social Accounts" then fill out of the fields on the next page, as shown below. Click save when you're done.
Complaints
As in spam complaints. No one wants to see these in a report, but they happen to even the best email lists. Don’t get too concerned about them, but do monitor them. Too many spam complaints can initiate deliverability issues.
If you’re seeing an increase in spam complaints, consider making the unsubscribe link in your emails easier to see. Also consider adding a second unsubscribe link to the header area of your email. Gmail added this for their users earlier this year, but all your non-Gmail subscribers won’t see that Gmail header unsubscribe link. Make it easy for people to unsubscribe. There is no sense forcing them to stay on your list.
List Growth
This metric applies to your entire email program, not just to specific campaigns. List growth is just like what it sounds like: a percentage that shows how much your list is growing or shrinking. To see positive list growth, you need to be adding more subscribers than those that are unsubscribing. For Pinpointe users: Check your “Contact List Statistics” report to see stats on new subscribers and unsubscribes for each of your lists.
Churn Rate
Churn rate is how many subscribers you lose over a period of time, usually a year. An annual churn rate of 20-30% is not uncommon. Churn rate is the silent killer of list growth. It is not uncommon for an email marketer to struggle to add new subscribers at a faster rate than people are unsubscribing.
Knowing how long your average subscriber stays on your list can help combat churn. Once you know when people tend to leave, send them an extra-special offer about a month before you predict they might go. You won’t re-engage all your about-to-lapse subscribers, but you will save some.
Delivery Rate
There’s a whole industry around deliverability rates. Some marketers struggle to keep their deliverability rates high. Others just follow best practices and do alright. So long as your deliverability rates are over 95%, all is well. Just monitor your list’s deliverability rates, or hire a service to watch them for you.
If you’re interested in learning more about deliverability rates, see our recent post The Truth About Email Deliverability.
Note that "Inbox Placement Rate" is different than deliverability rate. Inbox placement refers to what percent of emails reach your subscribers’ inboxes, as opposed to their bulk or spam folders.
Another measurement that matters for deliverability is Sender Score. See our recent deliverability post about the details of Sender Score. For just the basics, know Sender Score is rated from zero to 100. A good Sender Score is 90 or better, but even a 90 Sender Score will have deliverability issues.
Conversion Rate
To have a conversion rate, you’ll need a goal. The goal could be orders or report downloads, or something else. Whatever it is, you’ll also need a tracking system in place to see how people behave once they get to your site.
That tracking system is usually Google Analytics. It’s critical to connect the tracking system your email service provider uses to the tracking system you use on your site. Fortunately it’s not hard. Head over to the Google Analytics URL Builder and set up some tracking urls.
Or, if you’re a Pinpointe user, set up Google analytics tracking with one click. The video below shows you how.
Revenue Per Email Sent
This is where the rubber meets the road. Open and clicks and bounces and unsubscribes are all well and good, but this is business, and ultimately, it all comes down to money. Unfortunately, revenue per email sent is not tracked nearly as much as opens and clicks. That’s probably because it’s harder to track.
Once you know your conversion rate and the total you earned from your campaign, you’ll have this stat. Just divide how many emails you sent by how much you earned. For example, if you earned $5,000 from your last campaign and you sent 10,000 emails, your revenue per email sent is 50 cents.
You should know this metric for every email marketing campaign you send but also for your overall email program. That way you have a tidy figure – the average revenue per email sent – to measure every campaign you send against.
Subscriber Value (also called “Revenue Per Subscriber”)
This is another metric that applies to your entire list, not to specific campaigns. Some marketers measure email subscriber value as how much a subscriber is worth for as long as they’re subscribed. Other marketers look at the value of subscribers on an annual basis.
It’s easiest to calculate annual subscriber value, so let’s walk through that calculation. It’s pretty simple:
Annual revenue from your email program / # of subscribers = Revenue per subscriber
You may also want to calculate subscriber value for profit per subscriber. It’s a similar calculation:
Annual profit from your email program / # of subscribers = Profit per subscriber
Knowing this stat is invaluable for list growth efforts. Once you know subscriber value, you know how much you can afford to spend to acquire new subscribers. That one figure can determine which list-building techniques stay or go.
Engagement Over Time
This is a metric you’ll want to know, but you probably don’t need to track it too carefully. “Engagement over time” just refers to how long it takes for people to respond to your email.
As I’m sure you know already, the bulk of the responses to your emails come in fast, usually within hours. Some results trickle in over the course of the next few days. It’s handy to know roughly what percent of your results come in within certain time frames. That way, when your CEO wants to know how the email you just sent is doing, you can say, “We get 40% of our sales within 4 hours after an email goes out. We get 80% of sales within 24 hours. By 72 hours after the email has gone out we usually have 98% of our results.”
It’s good to know whether your most recent email is a winner or a loser as soon as possible. Just be sure you track what matters. You don’t want to get swayed by vanity analytics like open rates while your revenues go down.