Are you a little confused by email metrics? There’s a ton of things you can track, which is why looking at your email analytics can be a little daunting. How do you know what a good open rate is? How do your numbers stack up against others in the same field?
Analytics are a useful tool, but without benchmarks it can be hard to figure out how well your campaigns are really doing. To help, we’ve created this guide to give you valuable benchmarks to set realistic goals and give you tips to improve your success rates beyond the status quo.
Email Marketing Benchmarks
Every email campaign should have goals, but without benchmarks it’s hard to know what’s obtainable.
Epsilon, a marketing research company, used 8.7 billion emails across 140 clients to calculate some of the most critical email marketing benchmarks including your non-bounce rate, open rate and click-through rate.
The graph below shows these benchmarks from the first quarter of 2013, which is noted as Q12013 on the chart below, through the first quarter of 2015.
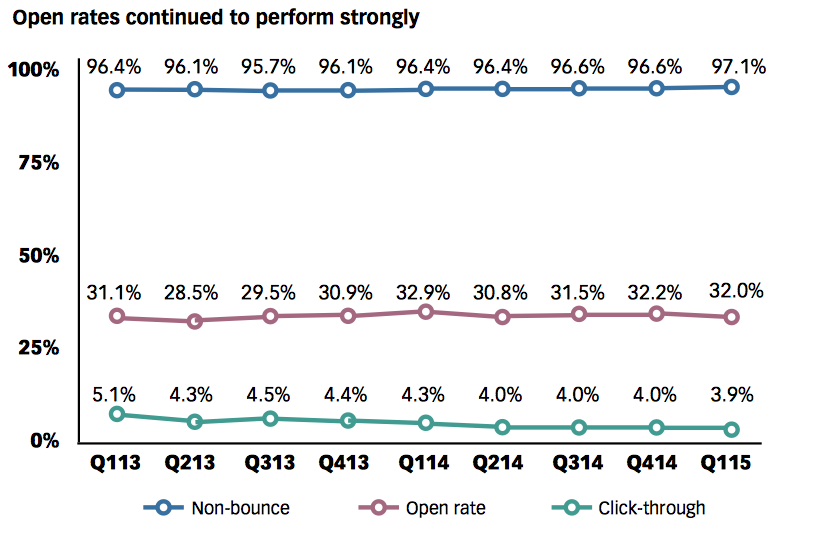
Non-bounce rate: 97.1%
Definition: Your non-bounce rate, or delivery rate, is the percentage of emails that arrive in inboxes. This excludes any emails that “bounced,” or never made it to their intended destination due to problems like a full inbox, server problems or invalid email addresses.
While everyone want’s 100 percent of their emails to end up in the proper inboxes, it’s not a reality. A small percentage will bounce. As long as your delivery rate hovers around 97 percent, you’re in good shape.
Open rate: 32%
Definition: Much like it sounds, your open rate is the percentage of subscribers that opened your email.
If you create an email campaign with the hope of obtaining an 80 percent open rate, you might want to pull back the reins a bit. For the past two years, the average open rate has hovered around 32 percent.
Click-through: 3.9%
Definition: Your click-through rate shows the percentage of subscribers that clicked on one or more links inside your email. This could include clicking on hyperlinked text or a call to action button.
Once a subscriber opens an email, you want him or her to take the next step and explore your business further. This metric measures that. It shows you how many subscribers clicked on a link or button in your email that took them to an external site like your business website or blog.
Click-through rates are often in the single digits. Currently, click-through rates are about 3.9 percent, which, as you can see in the chart, has held fairly steady over the past three quarters.
Conversion rate: 2-5%
Definition: Your conversion rate measures the number of contacts that followed through with your desired action like made a purchase or downloaded a paper from your site.
Conversion rates range between 2-5 percent, according to advertising agency, WordStream.
For many, this is a key metric. This group isn’t just opening an email once in awhile; this group is converting into serious, loyal customers. For most companies, 80 percent of revenue comes from just 20 percent of customers, which is why turning email subscribers into paying customers is a valuable return on investment.
Unsubscribe rate: 0.20%
Definition: The number of contacts that decide to opt out of your emails. These contacts click on the unsubscribe link in your email to end their email communications with you.
With most email metrics, you’re aiming for high percentages. That’s not the case with unsubscribe rates. You want the lowest possible number. We’re talking microscopic. Average unsubscribe rates are around 0.20 percent, according to research from marketing company, Marketo.
Email Marketing Benchmarks by Industry
While the benchmarks mentioned above provide an excellent starting point, it’s important to remember that every business is different. To provide a more focused look at email marketing benchmarks, here’s a look at data from Epsilon that offers average non-bounce, open and click-through rates for 13 industries.
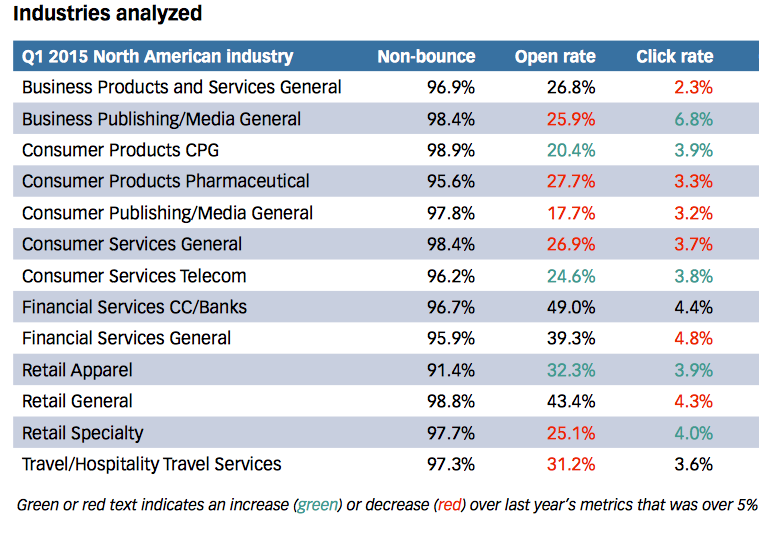
You’ll notice that non-bounce rates are between 96-98 percent, which is consistent with the benchmark we listed above. However, the open and click-through rates can be considerably different based on industry.
Open rates range from 17-49 percent. That’s a huge swing. Consumer Publishing has the lowest open rate at 17.7 percent, while top performers like Financial Services and Retail General have open rates of 49 and 43 percent, respectively.
Click-through rates also vary. Business Publishing is the top performing industry with a click-through rate of 6.8%, while Business Products and Services sits at the bottom of the conversion totem pole with 2.3 percent.
While the chart shows the range email benchmarks can have by industry, it also shows that a high open rate doesn’t always correlate to a high click-through rate. Take a look at Business Publishing. Its open rate is fairly low at 25 percent, but its click-through rate is the highest on the chart. It’s further proof that every industry has its own email marketing pulse.
Tips to improve your email stats
Now that you’re armed with data, you might be wondering how to give your email campaigns a boost. Don’t worry; we’ve got you covered. Here are tips to improve your non-bounce, open, click-through, conversion and unsubscribe rates.
Improve non-bounce rates
Every three to four months, go through your list and remove inactive customers. If you want, you can create a ‘We Miss You’ email with an incentive to bring them back, but if you don’t hear any response, it’s time to remove them from the list. A healthy list keeps delivery rates high.
- Work with a reputable email service provider
Using a reputable email service provider like Pinpointe keeps your emails from landing in a Spam folder. Working with a known email service provider shows email clients like Hotmail and Gmail that your email is legit and should go into an inbox. Plus, Pinpointe has an in-depth Spam Checker by Email On Acid that scores your email and gives you suggestions to keep your message out of the Spam box.
Improve open rates
- Write a creative headline
Thirty-three percent of subscribers decide whether or not to open an email based on the subject line alone. Be creative, use urgent language to convince subscribers to act and keep the length of your subject line between 40-50 characters.
- Use a respectable 'from label'
If an email arrives in your inbox from HowdyPartner@yahoo.com, will you open it? Of course not. Subscribers open emails from reputable companies, so make sure the email address that you use to send messages is respectable and has the company name in it.
Improve click-through rates
If your subscribers see scattered blocks of long text with images and links everywhere, your open rates will suffer. You won’t have to worry about layout with Pinpointe’s email templates, each one offers a crisp, modern look. Write a focused message, and use images as called for by the template you’re using.
- Clear call to action
Consider creating a call to action button for your email. That way, when subscribers scan your email, they’ll notice the button and instantly understand the action they should take.
Improve conversions
- Offer an incentive
Nothing makes subscribers act like an incentive. Want to make a sale? Create an email with a discount offer. Want subscribers to register for a webinar? Give them a free download of a white paper after the session that covers the webinar topic.
- Close the deal quickly
As soon as a subscriber clicks on your call to action, he or she should be able to complete the intended action quickly. If you want a subscriber to make a purchase, for example, the call to action link should take him or her to a shopping cart that enables a purchase to happen. The more steps a subscriber has to go through, the more likely they are to stop the process.
Improve unsubscribe rates
- Find the right frequency
The majority of contacts unsubscribe because they feel overwhelmed by too many emails. You have to find the right frequency for your audience. Here’s another benchmark for you. SmartInsights says 35 percent of companies email subscribers 2-3 times a month, and another 19 percent say they email between 4-5 times a month.
- Email relevant content
Make sure the content that you send is on-point and matches the subscriber’s preferences. Segment your list by gender, age, product preference or income to ensure the targeted messages reach the right audience. Pinpointe makes it easy by offering customized segment fields.
Conclusion
By understanding email benchmarks, you can plan your marketing campaigns with precision. During each campaign, watch your metrics. Use the benchmarks above to gauge your success. Be sure to take some time at the end of the campaign to analyze your stats and make notes that you can use to improve your next campaign.